
I’m 55, and I’ve started seriously thinking about my retirement. I enjoy my work, and as I’m lucky enough to be able to work from anywhere I have internet access and my laptop, it’s not the hard slog some people have. However, I still don’t want to be relying on earning a wage into my late 60s.
The trouble is, every article I read tells me something different. One headline says the average American has over half a million saved. Another one tells me I need $1.46 million to retire comfortably, or I’ll need to get a little part-time job. A third one shows me a chart of people my age with $50,000 in their 401(k) and says we’re all heading off a cliff.
I hate guesswork when it comes to finance, so I put my investigative journalist hat on and did some research by age, using sources I trust.
Empower publishes its data every quarter. JPMorgan puts out benchmarks tied to income. And what those numbers show, once you sit with them for a minute, is a much calmer picture than the headlines suggest, as long as you understand the difference between the average and the median.

What the Average American Needs to Retire By Age
Empower’s most recent retirement data puts the average US retirement account balance at around $547,000. People in their 60s have an average balance of more than $1.2 million, and people in their 80s still have an average balance of around $836,000. Those are real numbers from real accounts, pulled from millions of plan participants.
If you just read those figures and looked at your own balance, the first thing to do is take a deep breath and don’t go into immediate panic, as I did. My number doesn’t look like that, and I doubt yours does either, unless you’ve been planning your retirement since you were sixteen.
That gap between the headline average and your actual life is the whole story of this article. The average is being pulled up by a handful of very large balances at the top end, and the median, the middle person, is where most of us actually live.
Those are two very different conversations, and if you only look at the average, you’ll either feel hopelessly behind or falsely reassured.
Why the Average Lies, and the Median Is Kinder
Picture a room with 10 people in it. Nine of them have $100,000 saved, and one has $5 million. The average balance in that room is $590,000. The median, the middle person, is $100,000. Both numbers are technically correct, and they tell you completely different things about what’s normal.
That’s exactly what’s happening with US retirement data. The Federal Reserve’s Survey of Consumer Finances, which is the gold standard for this kind of thing, shows median retirement account balances that are dramatically lower than the averages you see splashed across the news.
For households headed by someone aged 55 to 64, the median retirement account balance sits closer to $185,000, not seven figures. For 65 to 74, the median is around $200,000. Most retirees in this country aren’t sitting on $1.2 million.
Which means if you’re at $210,000 at 62, you’re in fact the middle of the pack, not behind. The goal isn’t to hit some inflated target from a marketing survey, but to know which number you’re looking at and what it actually represents.
The Retirement Numbers by Age
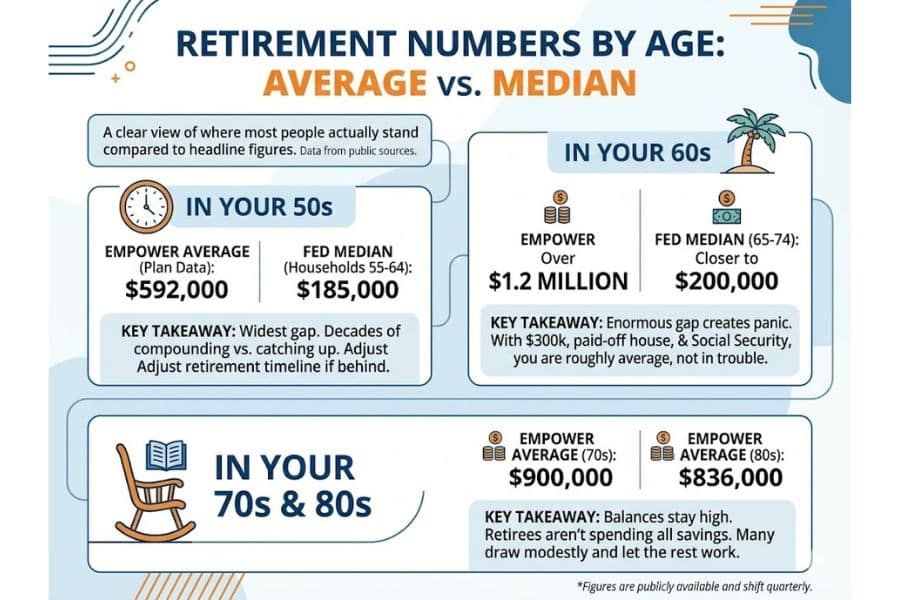
Let’s break it down by decade, using both the average from Empower’s plan data and the median from Federal Reserve household data, so you can see where the headline number ends and where most people actually land. I’m pulling these from publicly available figures, and they shift a bit each quarter, but the shape of the picture is steady.
Here’s what the landscape looks like at each stage:
- In your 50s. The Empower average for people in their 50s is roughly $592,000. The Fed’s median for households 55 to 64 is around $185,000. This is the decade when the gap between the average and the median is widest, because the people who started saving in their 20s and kept going are now seeing real compounding, while those who started late are still catching up. I’m in the latter group, the catching-up one, and the truth is I have less than the median. It’s not a disaster, because I’ve still got the better part of a decade if I push retirement to 62 or 63 instead of 60, but it told me something useful: the fantasy of stopping work at 60 and the math of stopping work at 60 weren’t currently on speaking terms in my household.
- In your 60s. The Empower average jumps to just over $1.2 million. The Fed median for 65 to 74 is closer to $200,000. That gap is enormous, and it’s the gap that causes most of the panic articles. If you’re in your 60s with $300,000 saved, plus a paid-off house, plus Social Security coming in, you’re not in trouble. You’re roughly average based on real numbers and calculations.
- In your 70s and 80s. Average balances stay surprisingly high, with Empower showing 70-somethings around $900,000 and 80-somethings at $836,000. Which means a lot of retirees aren’t, in fact, spending their savings. They’re drawing modest amounts and letting the rest keep working. That tells me something useful about how retirement actually goes, versus how the financial press dramatizes it.
The JPMorgan Benchmark by Income, Which I Found More Useful
Kiplinger covers a benchmark from JPMorgan that I found more practical than any of the age-only numbers, because it ties your target to what you actually earn. The logic is straightforward: someone earning $100,000 a year needs a different retirement number than someone earning $200,000, because their pre-retirement lifestyle costs more to replicate.
The JPMorgan model suggests that by age 55, a household earning $100,000 should aim for roughly 5 times their salary saved, so around $500,000. A household earning $200,000 at the same age should be targeting closer to 7 times salary, because Social Security replaces a smaller share of higher incomes.
By 65, those multiples climb to about 8 and 11 times salary, respectively. Those are guidelines only, and they assume you want to roughly maintain your current standard of living in retirement.
What I like about the income-based benchmark is that it stops the comparison game with strangers. It doesn’t matter what some 55-year-old in a different state with a different paycheck has saved. What matters is whether your number is in a sensible relationship to your income and your spending.
When I did the math against my own salary, I came out somewhere around 3.5 times instead of 5 times. That gave me a specific target to close in actual dollars, instead of a vague sense of doom.
What These Numbers Don’t Capture
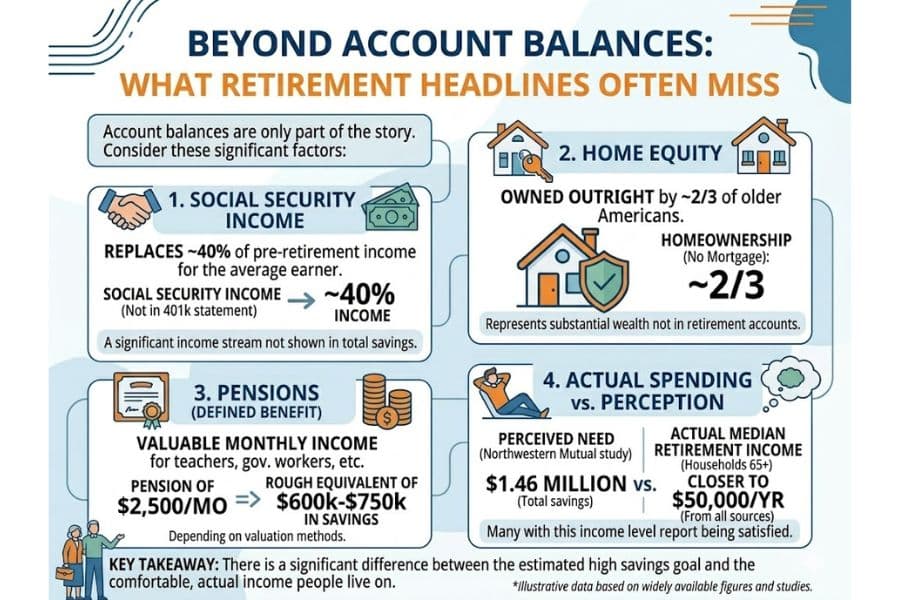
Account balances are only one piece of the retirement picture, and the headlines almost never mention the others. Social Security still replaces around 40% of pre-retirement income for the average earner, a substantial amount that doesn’t show up on any 401(k) statement.
Home equity, for the roughly two-thirds of older Americans who own their homes outright, is another big number sitting outside the retirement account total.
There are also pensions. Plenty of teachers, government workers, and long-tenured employees at older companies still have them. If you’ve got a pension paying $2,500 a month, that’s the rough equivalent of an extra $600,000 to $750,000 in savings, depending on how you value the income stream.
And then there’s the spending side, where surveys of what people feel they need don’t match what people actually retire on. The widely quoted $1.46 million figure from Northwestern Mutual’s annual study is what survey respondents say they’ll need. The actual median retirement income for households 65 and older is closer to $50,000 a year, much of it from Social Security, and most of those households report being satisfied with their finances.
There’s a wide gulf between the number people guess at when asked, and the number people actually live on, comfortably, when they get there.
What to Actually Do If Your Number Is Behind
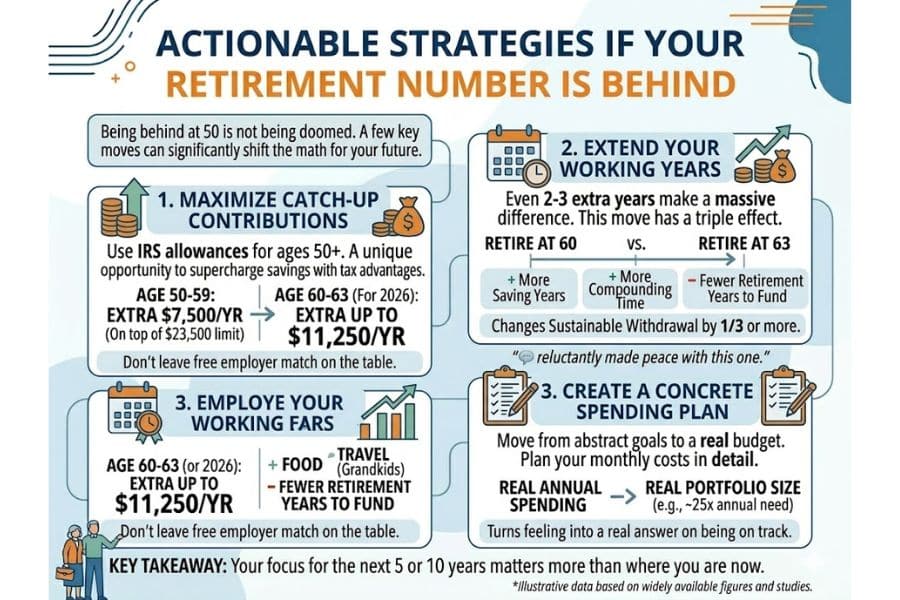
Being behind at 50 or 55 isn’t the same as being doomed at 50 or 55, and a handful of moves actually shift the math. I’ve been working through these myself, and some of them have made a bigger difference than I expected.
Catch-up contributions are the most obvious lever and the most underused one. Once you hit 50, the IRS lets you put an extra $7,500 a year into your 401(k) on top of the standard $23,500 limit. For 2026, there’s also a higher catch-up for people aged 60 to 63, allowing up to $11,250 extra.
Over five years, that’s tens of thousands of dollars in tax-advantaged contributions that someone in their 40s can’t make. If your employer matches, you’re leaving free money on the table by not maxing this out, assuming you can afford to.
Working two or three years longer is the other big lever, and it’s the one nobody wants to hear about. Pushing retirement from 60 to 63 does three things at once: it adds years of saving, it lets your existing balance keep compounding, and it shortens the number of years you need the money to last.
A retirement that starts at 63 instead of 60 isn’t a small adjustment. It can change your sustainable withdrawal by a third or more. I’ve made my peace with this one, reluctantly. The early-60s retirement is still on the table; the late-50s one isn’t.
The last piece, and this is the one I’d push hardest, is to actually write down what you think your retirement will cost, month by month. Housing, food, healthcare, insurance, the trip to see the grandkids, and the car that will need replacing.
Once you have that number, the savings target stops being abstract and becomes a reliable and concrete number. You can work backward from a real annual spending figure to a real portfolio size, usually around 25 times your annual withdrawal need, and suddenly the question of whether you’re on track has an answer instead of a feeling.
Where you are now matters less than what you do with the next five or 10 years.
Disclaimer: This article is for general information and is not personalized financial advice. Talk to a qualified financial planner about your own situation before making decisions about retirement savings or withdrawals.